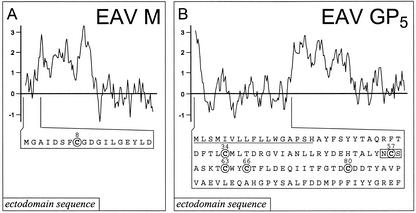
FIG. 1.
(A) Hydrophobicity plot and ectodomain sequence of the EAV M protein. The hydrophobicity plot was generated using the method of Kyte and Doolittle (26) and a moving window of 11; above the axis is hydrophobic. The position of the single, conserved Cys residue (Cys-8) in the M protein ectodomain sequence is indicated. (B) Hydrophobicity plot and ectodomain sequence of EAV GP5. See panel A for further details. In the GP5 ectodomain sequence, the (predicted) N-terminal signal sequence is underlined, the five Cys residues targeted in this study are indicated, and the single N-glycosylation site (Asn-56) is boxed.

