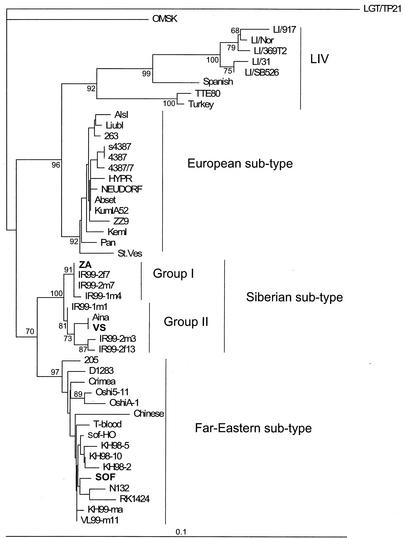
FIG. 4.
E protein phylogeny showing the position of ZA virus relative to 48 other TBE virus E protein sequences (see Materials and Methods). The phylogeny was estimated using ClustalX (default settings) but invoking the “exclude gaps” and “correct for multiple substitutions” options. Bootstrap values (percentage of 1,000 replicates) of >65% are shown above or below the branches. The three viruses in this study are shown in boldface. LIV, louping ill virus.

