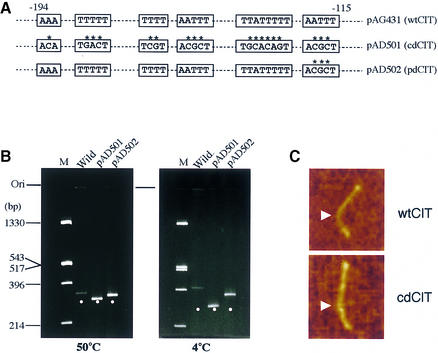
Figure 3.
Architecture of the CIT and its mutants. (A) The sequences of the mutations. (B) Wild-type and mutagenized fragments (289 bp) of which pAD501 (almost completely disrupted CIT, cdCIT) and pAD502 (partially disrupted CIT, pdCIT) were digested with SmaI and BglII, purified and subjected to 6% PAGE at 4 and 50°C. Positions of the 289 bp fragments are shown as dots. (C) AFM observation of the CIT fragment. PCR fragments (K-81 psbA2 5′-region, –404/–24) derived from pAG500 (–404/+113, wtCIT) or pKF501 (cdCIT) were observed. Photographs of wtCIT and cdCIT, respectively, shown in the direction from top (–404) to bottom (–24). Arrows indicate the position corresponding to the center locus (approximately –141 at 4°C) of the CIT.

