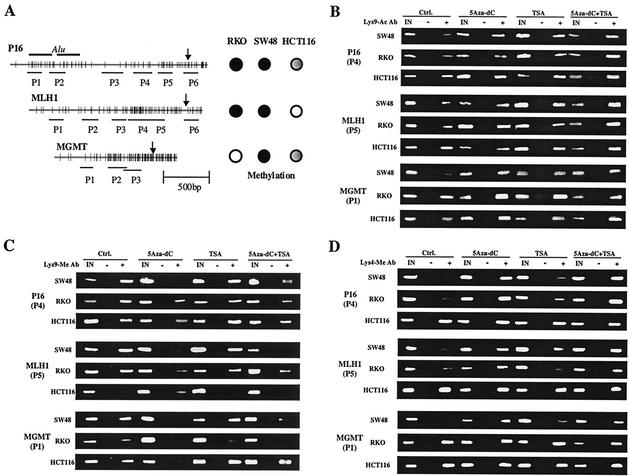
FIG. 1.
Examples of histone H3 lysine 9 CHIP assays. (A) Schema of the P16, MLH1, and MGMT promoter regions. The distribution of CpG sites is represented by vertical bars. Two Alu sequences are upstream of the P16 promoter region; arrows indicate transcription initiation sites. Lines shown below each promoter indicate regions amplified by each set of PCR primers. To the right of each gene, methylation status is indicated by filled circles (fully methylated), partially filled circles (partially methylated), and unfilled circles (unmethylated) in the three cell lines studied. (B) Examples of CHIP assays using anti-acetylated histone H3 Lys-9 antibody. (C) Examples of CHIP assays using anti-methylated histone H3 Lys-9 antibody. (D) Examples of CHIP assays using anti-methylated histone H3 Lys-4 antibody. In these assays, DNA combined with acetylated or methylated histone H3 Lys-9 antibody is immunoprecipitated and detected by PCR amplification. In panel B, note that the histone deacetylase inhibitor TSA induces moderate increased Lys-9 acetylation while the combination of the DNA methyltransferase inhibitor 5Aza-dC and TSA induces remarkable Lys-9 hyperacetylation. In panel C, note that 5Aza-dC and a combination of 5Aza-dC and TSA remarkably decrease Lys-9 methylation. In panel D, note that 5Aza-dC and a combination of 5Aza-dC and TSA remarkably increase Lys-4 methylation. IN, input DNA from whole-cell lysate. The intensities of the bands of PCR products were quantitated by densitometry or using the Agilent 2100 Bioanalyzer.

