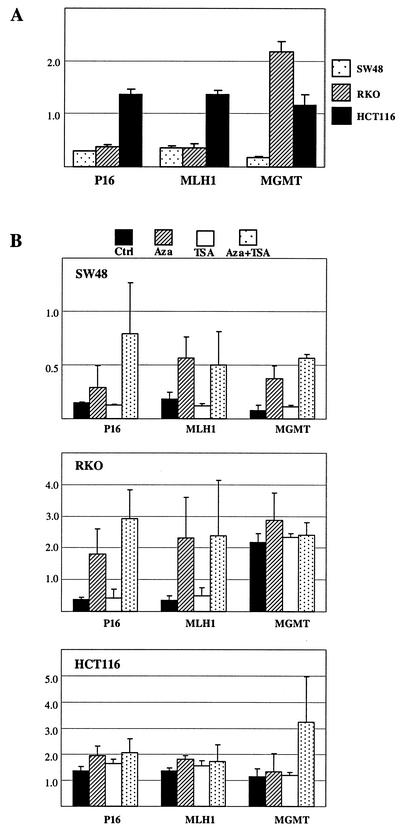
FIG. 4.
Average of histone H3 Lys-4 methylation in the SW48, RKO, and HCT116 cell lines. (A) Histone H3 Lys-4 methylation averaged across each promoter for P16, MLH1, and MGMT without treatment. Note that SW48, which shows dense DNA methylation at all three promoters, has much lower levels of Lys-4 methylation than HCT116, which has no DNA methylation at MLH1 and only partial DNA methylation at P16 and MGMT. (B) Dynamics of Lys-4 methylation in SW48, RKO, and HCT116 treated with 5Aza-dC (Aza), TSA, and both. Note that TSA has no effect by itself and that 5Aza-dC increases Lys-4 methylation in all three genes in SW48 and in P16 and MLH1 in RKO (where dense DNA methylation is present), with a much less pronounced effect in HCT116 (where DNA methylation is absent or partial at these loci and where Lys-4 methylation is already elevated at baseline, compared to SW48 and RKO. Error bars represent the SD of the averaged values for each gene calculated from the values of different regions.

