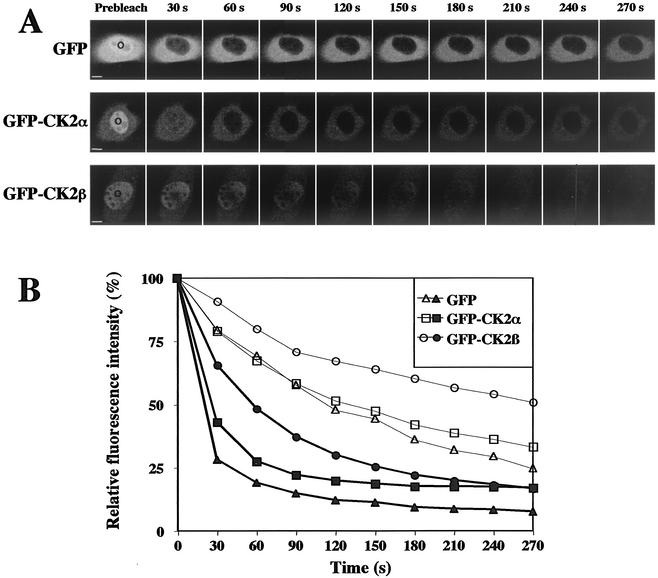
FIG. 6.
Mobility of CK2 subunits in living cells. NIH 3T3 cells stably expressing GFP, GFP-CK2α, or GFP-CK2β were repeatedly bleached for 15 s in the same nucleoplasmic spot. (A) Images show single z sections and were obtained before (Prebleach) and after the indicated time points. The area of the bleach is indicated with a circle. Bar, 5 μm. (B) Cells were imaged between bleach pulses and the loss of fluorescence of either the whole nucleus (solid symbols) or the cytoplasm (open symbols) was expressed as relative intensity (see Materials and Methods). Curves from cells were averaged (n = 6 cells) and plotted over a 270-s time frame.

