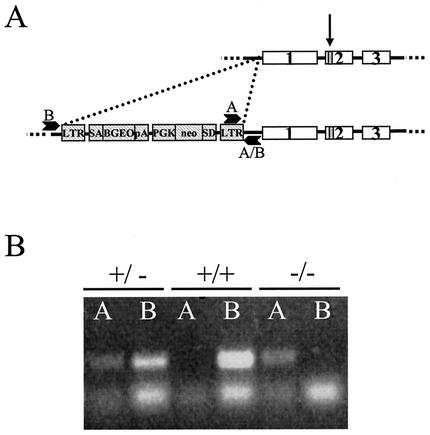
FIG. 1.
Disruption of mouse Trx-2. (A) Diagram showing the three exons of the Trx-2 locus (with an arrow indicating the location of active-site cysteines) (not drawn to scale), the retroviral insertion of LTR-SA-BGEO-pA-PGK-neo-SD-LTR2 (hatched boxes) 351 bp upstream of exon 1, and the location of genotyping PCR primers A and B. (B) Genotyping of mouse DNA by two PCRs: one PCR for the mutant allele (lanes A) and one PCR for the wild-type allele (lanes B). Trx-2+/− mice are positive for both A and B, Trx2+/+ (wild-type) mice are positive only for B, and Trx-2−/− mice are positive only for A. The top bands are the specific PCR products, and the bottom bands present in all of the lanes are the primer dimer.

