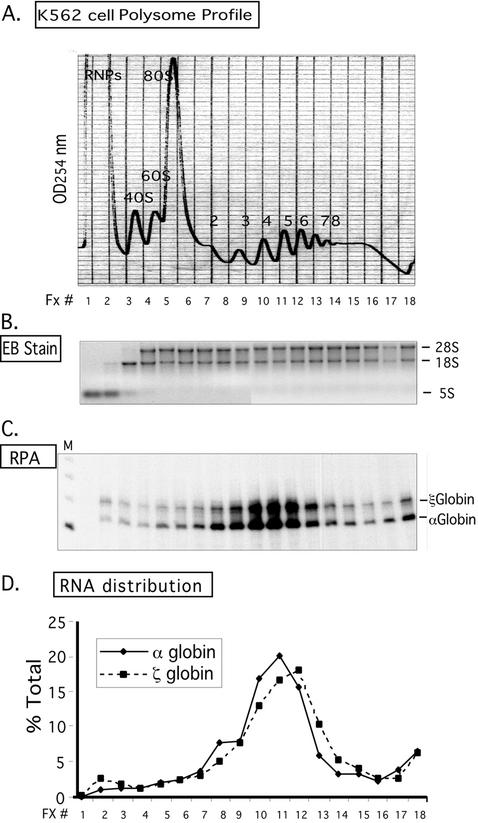
FIG. 2.
Distribution of hα- and ζ-globin mRNAs across a K562 cell polysome gradient. (A) Sucrose gradient profile of K562 cytosolic extract. The absorbance profile (OD254) of the gradient is shown. The top of the gradient is to the left; the positions of absorbance peaks corresponding to preribosomal RNPs, 40S, 60S, and 80S, and polysomes (2-, 3-, 4-, 5-, 6-, 7-, and 8-somes) are indicated. The 18 fractions (Fx #) collected for subsequent analysis are identified below the tracing. (B) Agarose gel electrophoresis of RNA extracted from the polysome gradient fractions. A 2-μg RNA sample from each fraction (in panel A) was applied to the gel and electrophoresed, and the abundant 28S, 18S, and 5S rRNAs were directly visualized by ethidium bromide staining. The distributions of these RNAs were consistent with the OD peak assignment (in panel A). (C) Detection of globin mRNAs across the K562 polysome gradient. Each gradient fraction was assessed for hα-globin and hζ-globin mRNAs by RPA with corresponding 32P-labeled probes. hα-globin and hζ-globin mRNAs protected probe fragments of 132 and 150 bp, respectively. (D) Distribution of globin mRNAs across the K562 polysome gradient. The contents of hα-globin and ζ-globin mRNAs in each fraction (in panel C) were quantified by PhosphorImager analysis. The amount of each mRNA species in each fraction is depicted as a percentage (ordinate) of the total for the corresponding species across the gradient.

