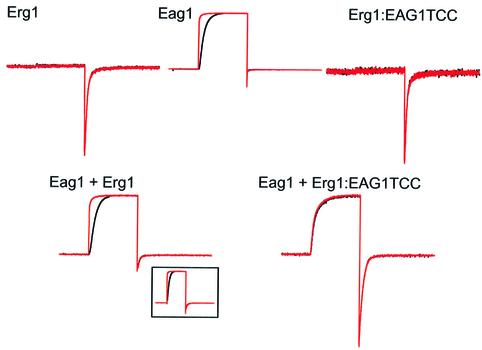
Fig. 7. Heteromeric interaction between Eag1 and Erg1:Eag1TCC. Currents were obtained in oocytes expressing wild-type Erg1, wild-type Eag1 or the chimera Erg1:Eag1TCC alone (upper traces), or co-expressing Eag1 + Erg1 or Eag1 + Erg1:Eag1TCC (lower traces). Current traces were obtained using a protocol designed to highlight both Eag1 and HERG properties which consisted of a long (5 s) preconditioning pulse to –140 mV (black traces) or –60 mV (red traces) followed by a depolarizing pulse to +60 mV for 1 s and a depolarization to –120 mV lasting for 1.5 s, and are shown after normalization to the maximal current value. Note the strong voltage dependence of the activation in Eag1 which is abolished in oocytes injected with Eag1+Erg1:Eag1TCC.

An official website of the United States government
Here's how you know
Official websites use .gov
A
.gov website belongs to an official
government organization in the United States.
Secure .gov websites use HTTPS
A lock (
) or https:// means you've safely
connected to the .gov website. Share sensitive
information only on official, secure websites.
