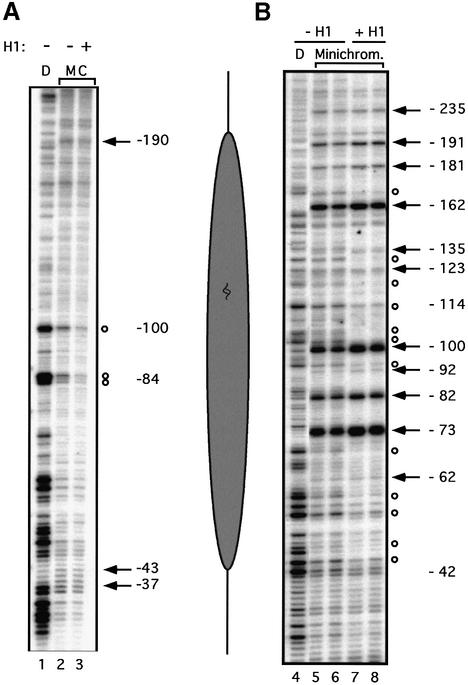
Fig. 5. Structural analysis of the promoter nucleosome in the presence or absence of histone H1. (A) High resolution mapping of the translational positioning. Reconstituted minichromosomes were mildly digested with MNase (20 s at 26°C) and the resulting fragments were amplified by linear PCR. Lane D: MNase digestion pattern on naked DNA. Lanes M and C: minichromosomes reconstituted in the presence or absence of H1 (as indicated above) treated with MNase. Cleavage sites protected in chromatin are indicated by open circles; hypersensitive sites are marked by black arrows. The numbers refer to the distance from the start of transcription. The diagram on the right shows the approximate position of the promoter nucleosome. (B) Rotational phasing. The rotational setting of the promoter nucleosome was determined by DNase I digestion of the minichromosomes followed by linear PCR amplification. Lane D: DNase I digestion pattern on naked DNA. Lanes Minichrom.: minichromosomes (with or without H1 as indicated above) digested for 2 min (lanes 5 and 7) and 4 min (lanes 6 and 8) with DNase I. The alternate enhancements (arrows) and protections (circles) show a periodicity of ∼10 bp. The numbers refer to the distance from the transcription start.

An official website of the United States government
Here's how you know
Official websites use .gov
A
.gov website belongs to an official
government organization in the United States.
Secure .gov websites use HTTPS
A lock (
) or https:// means you've safely
connected to the .gov website. Share sensitive
information only on official, secure websites.
