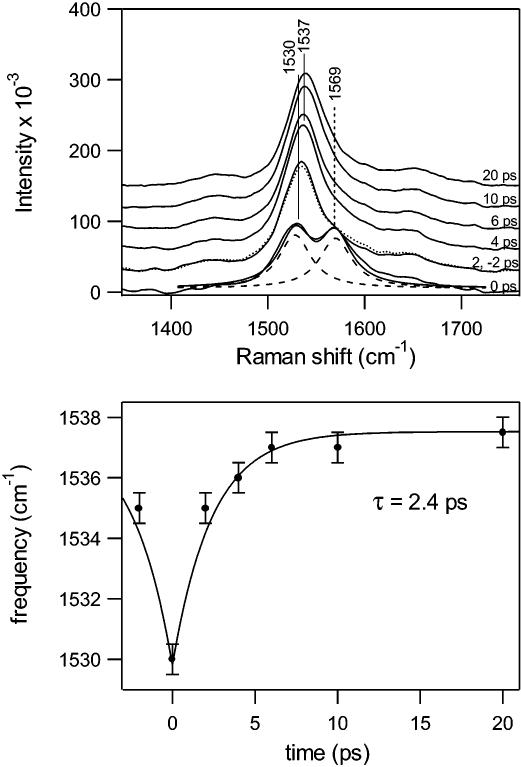
Figure 5.
Expanded view (top panel) of the ethylenic region of the Stokes Raman difference spectra from −2 to 20 ps. The +2 (solid) and −2 ps (dotted) spectra are overlayed. The dashed marker indicates the transient S1 peak. The doublet in the 0 ps spectrum was decomposed into two Lorentzian peaks (dashed curves), and the sum of these two Lorentzians are shown as the solid curve on top of the 0 ps spectrum. The bottom panel shows the ethylenic frequency () as a function of pump−probe time delay. The solid curve is a single-exponential least-squares fit to the data with a rise time of 2.4 ps.

