
Fig. 3.
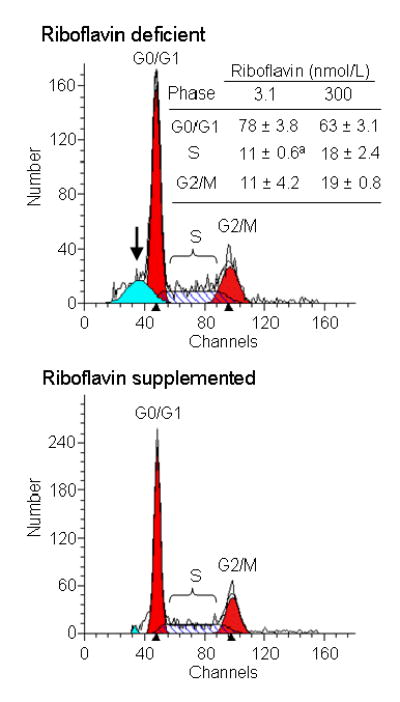
Riboflavin deficiency causes G1 phase arrest in HepG2 cells. Cells were cultured in media containing 3.1 and 300 nmol/L riboflavin for 4 d. Cell cycle distribution was quantified by flow cytometry. Representative flow cytometry charts are depicted; the arrow denotes apoptotic cells in the riboflavin deficient group. The insert provides a table with percent cell cycle distributions. aSignificantly different from riboflavin-sufficient controls (P < 0.05; n = 3).