
Fig. 4.
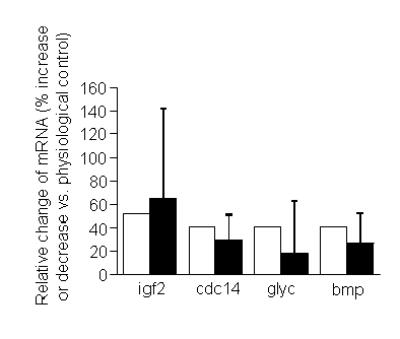
Comparative analysis of gene expression by DNA microarrays and reverse transcriptase polymerase chain reaction (RT-PCR) in HepG2 cells. Abundances of mRNA encoding the following four genes were quantified (GenBank accession number): bmp, bone morphogenetic protein 4 (D30751); cdc14, cell division cycle 14 homolog A (NM_003672.1); glyc, cartilage glycoprotein-39 (M80927.1); igf2, insulin-like growth factor 2 (NM_000612.2). Percent changes may refer to decreased or increased abundance of mRNA in cells cultured in media containing 3.1 or 300 nmol/L riboflavin compared with physiological controls (see text). Open bars = DNA microarray; black bars = RT-PCR (n = 4 - 5 for RT-PCR).