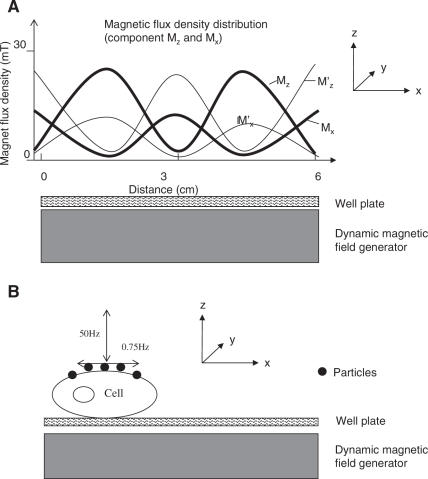
Figure 2.
Magnetic flux densities after the application of pulsating field on cells. (A) The dynamic field generator, [Dynamic Marker, Stetter Electronik, Seeheim-Jugenheim, Germany (http://www.feldkraft.de)] was placed under the 6-well plate; the distance between the surface of the generator and the cells is 2 mm. The 6-well plate is placed in the x, y plane. The z-direction is perpendicular to the plate. The applied magnetic field strength is described in its three main directions x, y and z, as indicated in the figure, whereas the field strength in x-direction is called Mx, the field strength in y-direction (perpendicular to the plane of the figure) My, and the field strength z perpendicular to the 6-well plate Mz. Mz and Mx are sinusoidal in x-direction, whereas My is homogeneous and very low (data not shown). Additionally, the magnetic field is alternating with a frequency of 0.75 Hz between two extreme positions in the x-direction. The magnetic field strength distribution for these two extreme positions is shown in the figure (Mz and ; Mx and ). (B) Schematic illustration of the cell/particle interaction within the pulsating magnetic field.

