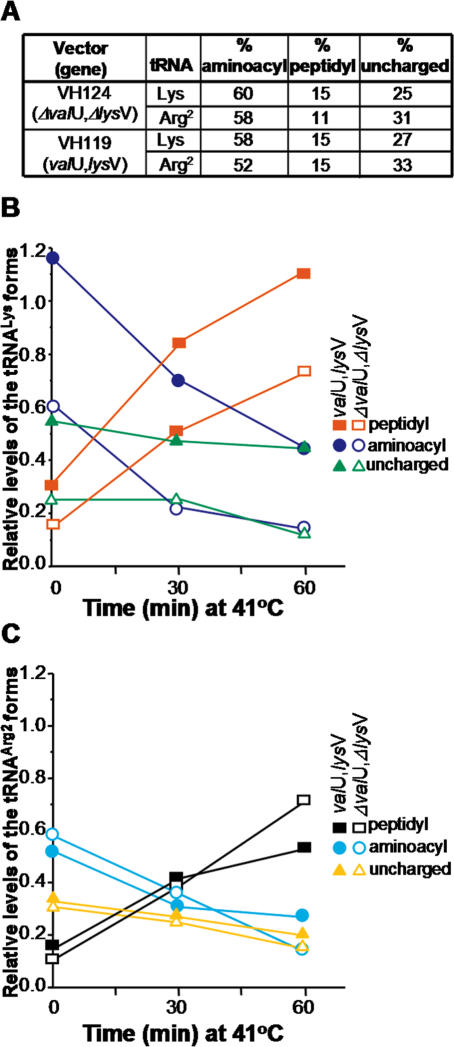
Figure 4.
The concentration of lysyl-tRNALys in transformed pth(Ts) cells decreases during incubation at 41°C. (A) Presents the relative amounts of aminoacyl-, peptidyl- and uncharged-tRNA in strain AA7852 transformed with pVH124 (ΔvalU, ΔlysV) or pVH119 (valU, lysV) and incubated at 32°C. The percentage of each of the tRNA forms relative to total tRNA (uncharged plus aminocylated plus peptidylated tRNA) was estimated by comparing the signal intensities before and after treatment with CuSO4 (Figure 3). In (B and C), changes in the relative fractions of the Lys and Arg2 tRNA forms, respectively, during suppression of the Pth(Ts) phenotype mediated by the overproduction of tRNALys are shown. Experiments conducted with AA7852 cells transformed with pVH119 (valU, lysV) are indicated by closed symbols, whilst those that involved pVH124 (ΔvalU, ΔlysV) transformants are shown by open symbols: in each case p-tRNALys is represented by red squares, aminoacyl-tRNALys by blue circles, uncharged-tRNALys by green triangles, p-tRNAArg2 by black squares, aminoacyl-tRNAArg2 by cyan circles, and uncharged-tRNAArg2 by yellow triangles. The additional amount of tRNALys produced by the pVH119 transformant was estimated with respect to the concentration of tRNAArg2, which was considered to be unaffected by the overproduction of tRNALys. Two successive hybridisations were conducted on the same membrane, first using a tRNALys probe and then with a tRNAArg2 probe, in order to normalize for the RNA load in different lanes. These data indicate that the total concentration of tRNALys in cells transformed with pVH119 was 2-fold higher than that in cells transformed with pVH124. The relative levels of the tRNALys forms in (B) have been multiplied by 2 to take this account. The data correspond to a representative experiment.

