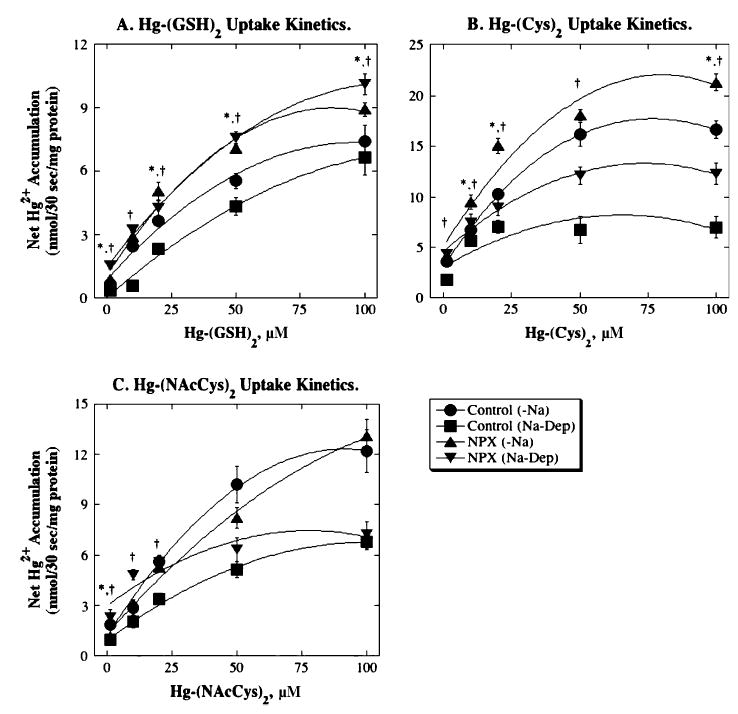
FIG. 4.

Michaelis-Menten kinetics of Hg2+-thiol conjugate transport in BLM vesicles from control and NPX rat kidney(s). Values for net accumulation of Hg2+ after 30-s incubations with 1, 10, 20, 50, or 100 μM Hg-(GSH)2, Hg-(Cys)2, or Hg-(NAcCys)2 are plotted. Results are means ± SE of measurements from separate membrane vesicle preparations from three control and three NPX rats. Curves were obtained by polynomial regression analysis. *Significant difference (p < 0.05) between values in BLM vesicles from control and NPX rats for uptake −Na+. †Significant difference (p < 0.05) between values in BLM vesicles from control and NPX rats for Na+-dependent uptake. Regression curves and correlation coefficients are as follows: Panel A: Control (−Na+): Y = 0.0284 + 0.10725X − 0.00041X2, r2 =0.988; Control (Na+-Dep.): Y =0.8844 + 0.13423X − 0.00070X2, r2 =0.984; NPX (−Na+): Y =1.1086 + 0.18049X − 0.00103X2, r2 = 0.976; NPX (Na+-Dep.): Y = 1.4933 + 0.15653X − 0.000705X2, r2 = 0.998. Panel B: Control (−Na+): Y = 3.0647 + 0.42X − 0.00344X2, r2 = 0.999; Control(Na+-Dep.): Y =3.0609 + 0.1576X − 0.00120X2, r2 =0.678; NPX (−Na+): Y =5.158 + 0.425X − 0.00266X2, r2 =0.940; NPX (Na+-Dep.): Y =4.619 + 0.237X − 0.00161X2, r2 = 0.981. Panel C: Control (−Na+): Y = 1.1851 + 0.2437X − 0.00133X2, r2 = 0.992; Control (Na+-Dep.): Y = 0.9464 + 0.1162X − 0.000581X2, r2 = 0.993; NPX (−Na+): Y = 1.307 + 0.1756X − 0.000585X2, r2 = 0.991; NPX (Na+-Dep.): Y = 3.008 + 0.1144X − 0.000736X2, r2 = 0.864.
