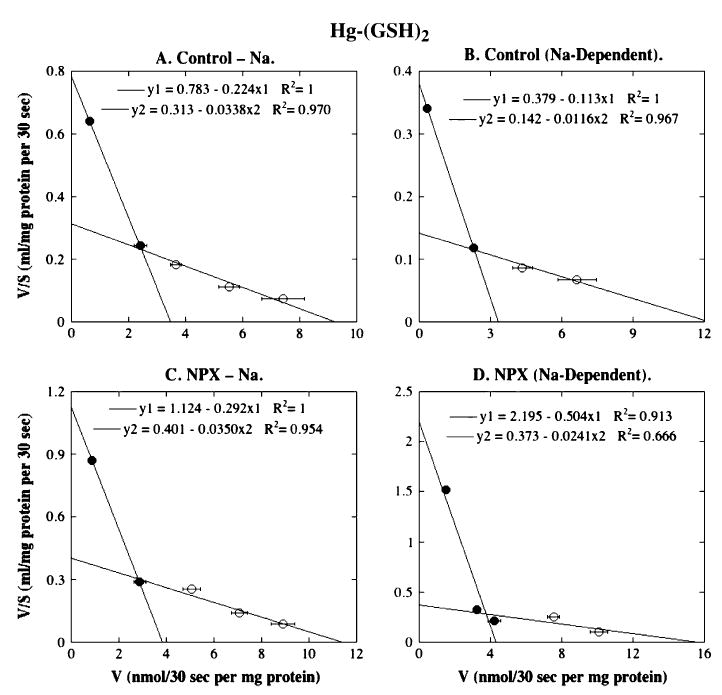
FIG. 5.

Eadie-Hofstee plots for Hg-(GSH)2 transport in BLM vesicles from control and NPX rat kidney(s). Initial rates of Hg-(GSH)2 transport derived from Figure 3A for Na+-independent and Na+-dependent uptake were linearized by Eadie-Hofstee analysis and represent means ± SE of measurements from separate membrane vesicle preparations from three control and three NPX rats. Where not visible, error bars were within the size of the data point. Filled and open symbols represent data points from different ranges that were selected to provide the best fit for linear regression.
