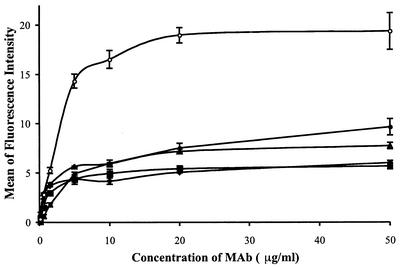
FIG. 3.
Titration curves for CD4BS MAb binding to cell surface Env. HEK 293T cells were cotransfected with pPPI4-gp140Twt and pDsRed2-N1. The immunostaining procedure was performed with different concentrations of b12 (•) or 2G12 (○), 205-46-9 (▪), 205-42-15 (⧫), or 205-43-1 (▴) followed by 10 μg of FITC-labeled goat F(ab′)2 anti-human IgG/ml. Nonspecific fluorescence due to the secondary antibody was subtracted from the mean of the fluorescence intensity values. The data shown were obtained from two independent experiments of similar design. The half-maximal binding concentrations for each MAb were 2.83 μg/ml for b12, 0.57 μg/ml for 205-46-9, 0.27 μg/ml for 205-42-15, 0.46 μg/ml for 205-43-1, and 2.43 μg/ml for 2G12.

