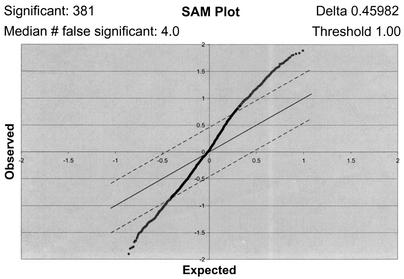
FIG. 1.
One-class analysis of the T-cell microarray data set. The seven T-cell arrays were subjected to a SAM one-class analysis where the software created a field of observed versus expected gene regulation values from the array data. Threshold and delta parameter values (upper right corner) were chosen to limit the field and calculate significantly and falsely significantly regulated genes (upper left corner). The threshold value was set at 1.00, corresponding to a twofold difference in regulation from the uninfected control. Dashed lines, delta parameter, which defines the significance field; dots above the upper line, probable significantly up-regulated genes; dots below the lower line, probable significantly down-regulated genes.

