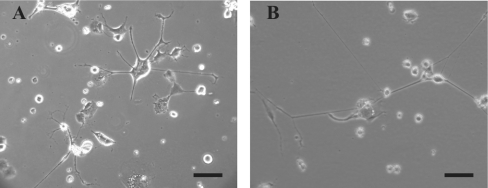
Figure 1. Optical micrographs of jetted and control CAD cells.
Optical micrographs obtained using a phase-contrast microscope with a 10× objective are shown. The scale bar represents 100 μm. (A) Control CAD cells; (B) CAD cells that were jetted at 7 kV. The pictures were taken approx. 1 month after the cells were jetted.

