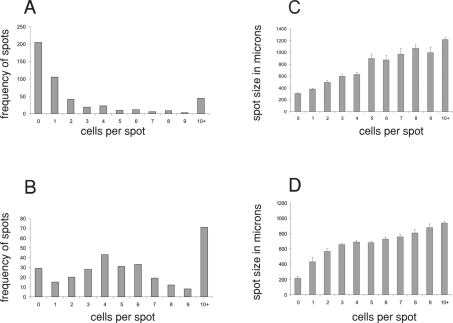
Figure 3. Histograms of droplet relic sizes and their cell content after jetting at 7 and 10 kV.
The histograms in (A) and (B) show the frequency of droplet relics plotted against cell content of the relic, and the histograms in (C) and (D) show the size distribution of droplet relics plotted against the cell content of the relic. The cells used in (A) and (C) were sprayed at 7 kV and the cells used in (B) and (D) were sprayed at 10 kV.

