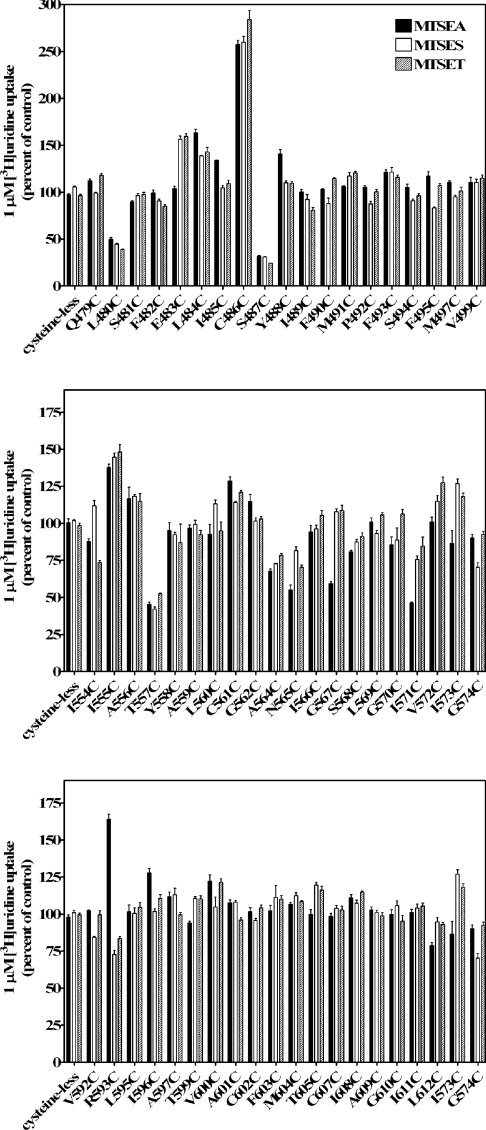
Figure 4. Reactivity of cysteine residues within TM 11 (top panel), TM 12 (middle panel) and TM 13 (bottom panel) with three MTS reagents.
Mutants are designated by the single-letter amino acid abbreviation for the targeted residue, followed by the sequence position number in hCNT3 and a second letter indicating the cysteine replacement. These three panels show the effects of MTSEA, MTSES and MTSET on the ability of single-cysteine substituted mutants to transport 1 μM [3H]uridine. Activity is expressed as the mean percentage of control value (no MTS reagent) for each individual mutant with standard deviations of quadruplicate values from a representative experiment. Black bars, 2.5 mM MTSEA; white bars, 10 mM MTSES; shaded bars, 1 mM MTSET. Three independent experiments were performed and similar results were obtained.

