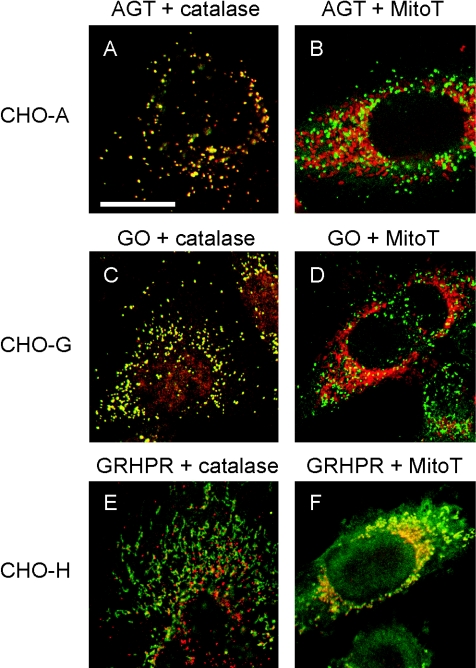
Figure 2. Analysis of the intracellular distribution of AGT, GO and GR/HPR in singly transformed CHO cells by immunofluorescence microscopy.
CHO-A cells were double labelled for AGT and the peroxisomal marker catalase (A), or AGT and the mitochondrial marker MitoTracker (MitoT) (B). CHO-G cells were double labelled for GO and catalase (C), or GO and MitoTracker (D). CHO-H cells were double labelled for GR/HPR and catalase (E), or GR/HPR and MitoTracker (F). Catalase and MitoTracker are shown in red, whereas AGT, GO and GR/HPR are shown in green. Bar=20 μm, with all images being at the same magnification. AGT and GO are mainly peroxisomal (i.e. they co-localize with catalase, but not MitoTracker). GR/HPR is both cytosolic and mitochondrial (i.e. it is both diffuse and co-localized with MitoTracker, but not catalase).

