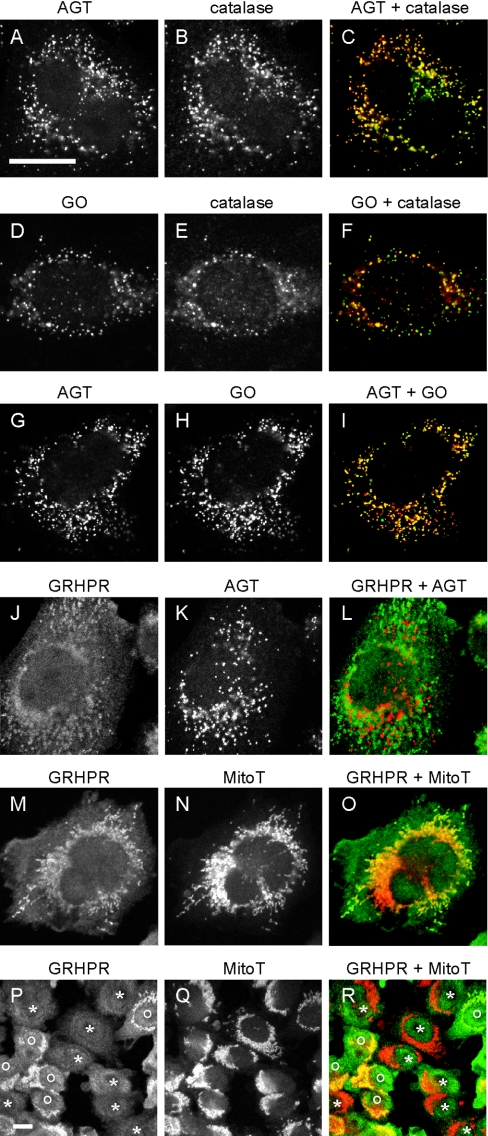
Figure 4. Analysis of the intracellular distribution of AGT, GO and GR/HPR in triply transformed CHO cells by immunofluorescence microscopy.
CHO-AGH cells were double-labelled for all combinations of test enzymes and markers, except GO+GR/HPR due to secondary antibody cross-reactivity. Cell were labelled as follows: AGT (green) and catalase (red) (A–C), GO (green) and catalase (red) (D–F), AGT (red) and GO (green) (G–I), GR/HPR (green) and AGT (red) (J–L), or GR/HPR (green) and MitoTracker (red) (M–R). Bars=20 μm. (A–O) are the same magnification, as are (P–R). AGT and GO are mainly peroxisomal, whereas GR/HPR is partly cytosolic and partly mitochondrial. In the lower magnification images (P–R): *, cells in which the GR/HPR distribution is entirely diffuse (cytosolic); o, cells in which the GR/HPR distribution is also mitochondrial.

