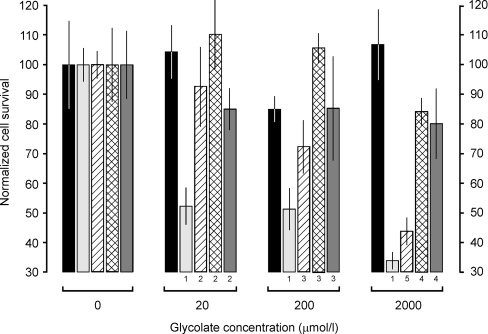
Figure 5. Indirect toxicity of glycolate in transformed CHO cells.
The normalized cell survival is the number of cells surviving after 2 days of culture in the presence of various concentrations of glycolate expressed as a percentage of those surviving in the absence of glycolate (see Experimental section for details). Normalization of the 0 μM glycolate points to 100% was necessary because of the different growth rates of the clones in the different antibiotics (see Table 1). The histograms are coded left to right as follows: black, untransformed CHO-O cells; light grey, CHO-G cells; hatch, CHO-AG cells; crosshatch, CHO-GH cells; dark grey, CHO-AGH cells. The results are expressed as means±S.D. (n=6). The numbers underneath some of the histograms indicate the probabilities of significance (P) of the differences between the means, as determined by the Student–Newman–Keul's multiple comparison t test, as follows: 1, P<0.001 compared with CHO-G (0 μM glycolate); 2, P<0.001 compared with CHO-G (20 μM glycolate); 3, P<0.001 compared with CHO-G (200 μM glycolate); 4, P<0.001 compared with CHO-G (2000 μM glycolate); 5, P<0.01 compared with CHO-G (2000 μM glycolate). The results for CHO-A, CHO-H and CHO-AH were similar to that for CHO-O (results not shown).

