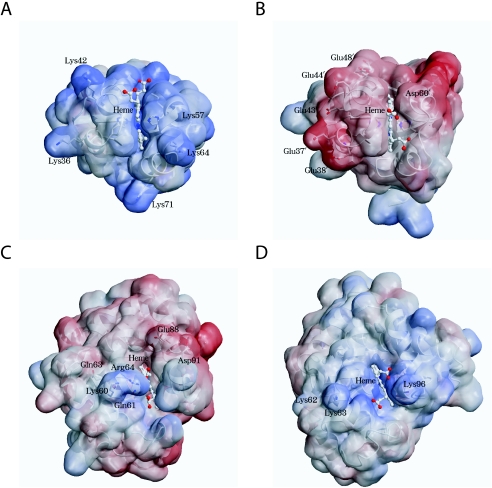
Figure 9. Comparison of the electrostatic molecular surfaces around the haem crevices of A. suum (A) and bovine (B) cytochrome b5, and A. suum model (C) and horse metmyoglobins (D) (PDB code 1WLA).
The electrostatic potential mapped on the protein surface was calculated using APBS [51]. A positive potential is indicated in blue, and a negative one is indicated in red.

