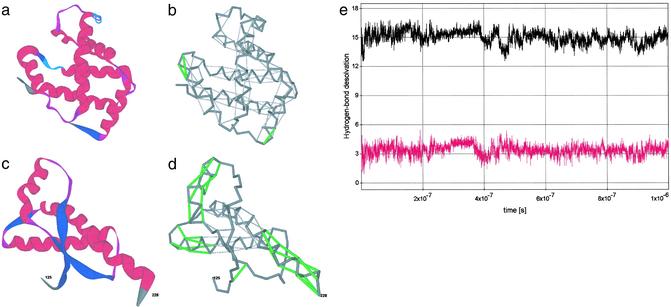
Figure 2.
(a–d) Ribbon structure and backbone hydrogen-bond pattern for Hb β-subunit (PDB ID code 1bz0, a and b) and human prion protein (PDB ID code 1qm0, c and d). A dark-gray series of virtual bonds joining consecutive α-carbons represents the backbone in b and d. The sufficiently wrapped amide-carbonyl hydrogen bonds are represented by light-gray thin lines joining the α-carbons of paired residues, and the underwrapped hydrogen bonds are represented by green lines (b and d). Time-dependent average extent ρ = ρ(t) of backbone hydrogen-bond dehydration (black plot), and dispersion σ = σ(t) (red plot) over all backbone hydrogen bonds appearing along a time sequence of chain conformations extracted from the Duan–Kollman trajectory (21) are shown (e).

