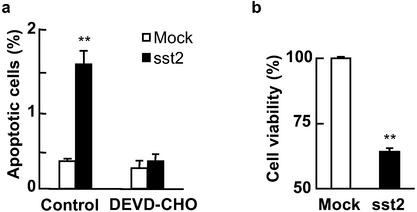
Figure 1.
Quantification of cell death in BxPC-3 cells expressing or not expressing sst2. (a) Mock- and sst2-transfected BxPC-3 were grown and starved for 48 h in the presence or absence (control) of 10 μM DEVD-CHO. Apoptotic cells were detected by immunocytochemistry of cleaved CK18. Results are expressed as mean ± SEM (n = 3). (b) MTT assay. Mock- and sst2-transfected BxPC-3 cells were grown (104 cells per well) and starved for 48 h. Data points represent the mean ± SEM (n = 3) and are expressed as the percentage of the cell viability observed in mock-transfected cells. *, P < 0.05; **, P < 0.01 for sst2- vs. mock-transfected cells.

