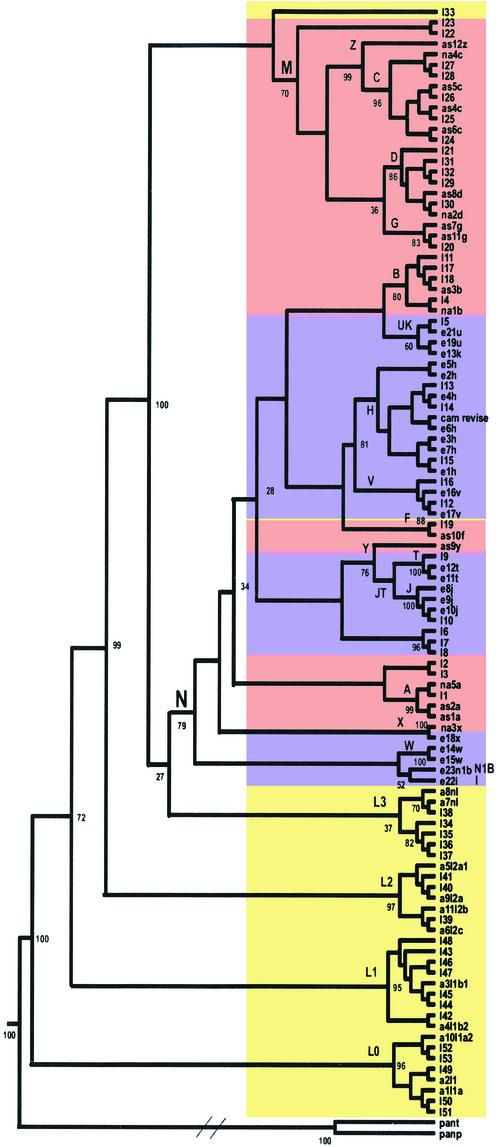
Figure 1.
Consensus neighbor-joining tree of 104 human mtDNA complete sequences. Numbers correspond to bootstrap values (percentage of 500 total bootstrap replicates). Because this is a consensus tree, based on bootstrapping, the branch length is not proportional to the mutation numbers. Diagonal lines are drawn in the chimp lineage to denote the much greater genetic distance between human and chimp than among the various human mtDNAs. Maximum likelihood and unweighted pair group method with arithmetic mean methods yielded the same branching orders with respect to the geographically delimited mtDNA haplogroups. Sequences are: I1–53, GenBank accession nos. AF346963–AF347015, numbered according to figure 2 in Ingman et al. (8), starting from the top of that figure; e21u, GenBank accession no. X93334; a1l1a, GenBank accession no. D38112; cam revise, GenBank accession no. NC_001807 corrected according to ref. 10; the rest are 48 sequences generated by us by using Applied Biosystems 377. Colors correspond to the continental origin of the individuals chosen for this analysis: yellow, Africans; purple, European; pink, Asians and Native Americans. Specific mutations in patient samples that have been implicated in disease were excluded from this analysis, as were gaps and deletions, with the exception of the 9-bp deletion (nucleotide positions 8272–8280). Haplogroup names are designated with capital letters. Pan paniscus and Pan troglodytes mtDNA sequences were used as outgroups. Haplogroups L0 and L1 replace the previously defined haplogroups L1a and L1b, respectively (35).

