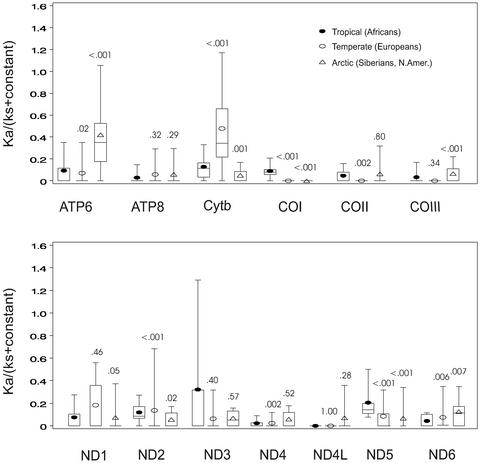
Figure 3.
Distribution of the relative selective constrains [ka/(ks + constant)] calculated for the human mtDNA lineages associated with different climatic zones: tropical and subtropical (African), temperate (European), and arctic and subarctic (Siberian and Native American). Calculation of ka/(ks + constant) and distribution of values are as presented in Fig. 2. Numbers above plots represent P values (Wilcoxon rank-sum test) for the comparison of the distribution of ka/(ks + constant) values for tropical (L0–L3) to temperate (H, V, U, J, T, I, X, N1b, and W) or arctic (A, C, D, G, X, Y, and Z) zones. Very similar distributions and P values were obtained for the arctic whether or not haplogroup B mtDNAs were included in the calculation. Similar results have been obtained by calculating ka/(ks + ka) where significant differences (P ≤ 0.01) were found between tropical (Africans) and arctic (Siberians and Native Americans) for the ND1, ND3, ND5, ND6, COI, COIII, ATP6, and ATP8 genes and between tropical and temperate (Europeans) for the ND1, ND2, ND5, ND6, cytb, COI, COII, and ATP8 genes (Table 2, which is published as supporting information on the PNAS web site). To control for the possibility that the observed differences in the distribution of ka/(ks + constant) ratios were simply an artifact of pairwise calculations, we also compared the raw number of nsyn and syn mutations for each lineage. Using ATP6 as an example, the nsyn/syn ratio for the tropics was 3/15 (0.20), temperate 5/6 (0.83), and arctic 7/5 (1.4). By two-tailed Fisher's exact test, the tropical to arctic ratios were significantly different (P ≤ 0.05). To determine the importance of the distribution of nsyn and syn mutations along individual mtDNA lineages on ka/(ks + constant), we used paml (36) to chart the locations of nsyn and syn variants for ATP6 in the arctic A–D and X and the tropical L0–L3 haplogroups. This process revealed that nsyn and syn mutations were relatively uniformly distributed across the A–D and X lineages, whereas the few African ATP6 variants were located near the ends of the L0 and L3 branches.

