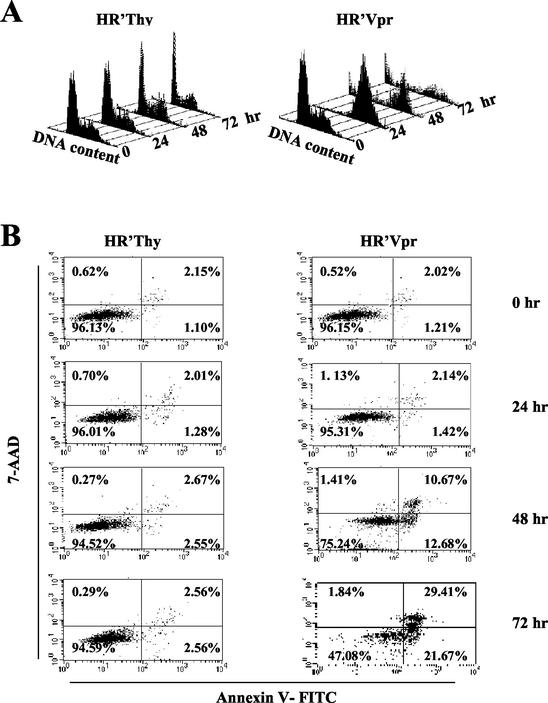
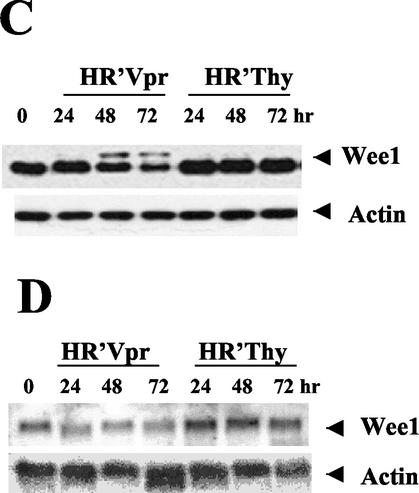
FIG. 1.
Wee-1 levels decrease in Vpr-induced apoptotic cells. HeLa cells were infected and analyzed for both cell cycle and apoptosis as previously described (9, 12). All stained cells were analyzed on a FACScan II (Becton Dickinson) and acquired by the Cell Quest software package. (A) Cell cycle profile of HeLa cells in response to HR′Vpr infection. Virus stock was produced and titrated to ensure that more than 95% of HeLa cells were arrested in G2 phase at 24 h postinfection (the equivalent of 1.2 μg of viral p24 was used for 2 × 10⁵ HeLa cells per well of a six-well plate [Falcon]). Equivalent amounts of HR′Thy virus were used as negative control. Cells were stained with PI, and DNA profiles of 5,000 cells were analyzed at the indicated times. (B) Kinetics of apoptosis after virus infection. HeLa cells were stained with Annexin V-FITC and 7-AAD at the indicated times. Percentages of positive cells within a quadrant are indicated. The lower right quadrant represents apoptotic cells. The upper right quadrant represents dead cells. (C) Protein immunoblot of Wee-1. Twenty micrograms of cell lysate was loaded in each lane and separated by SDS-10% PAGE, followed by immunoblotting with antibodies to Wee-1 or β-actin. (D) Northern blot analysis of Wee-1 RNA. Ten micrograms of total RNA was transferred to a nitrocellulose membrane and hybridized with human Wee-1 (nt 648 to 1938) and β-actin cDNAs in ExpressHyb hybridization solution.


