Figure 1.
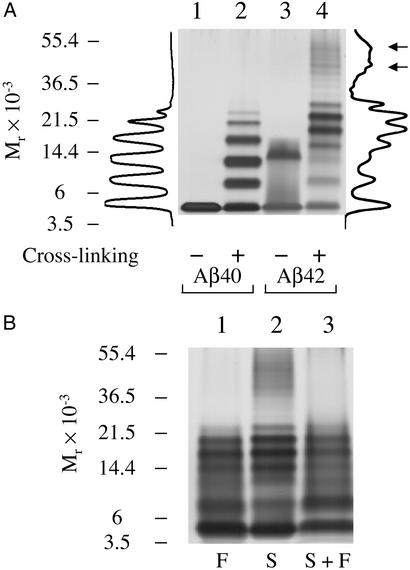
PICUP reveals distinct oligomer distributions for Aβ40 and Aβ42. LMW Aβ40 and Aβ42 were cross-linked immediately after preparation by SEC and analyzed by SDS/PAGE/silver staining. (A) Noncross-linked (lanes 1 and 3) or cross-linked (lanes 2 and 4) Aβ40 and Aβ42. Intensity profiles of lanes 2 (cross-linked Aβ40) and 4 (cross-linked Aβ42) are shown (left and right of the gel, respectively). These profiles were generated by using ONE-DSCAN (Scanalytics, Fairfax, VA). Arrows next to the intensity profile of cross-linked Aβ42 indicate intensity maxima corresponding to presumptive dodecamer and octadecamer species. (B) PICUP chemistry was performed on LMW Aβ42 samples immediately after preparation by filtration (“F”) through a 10,000 Mr cut-off filter (lane 1), SEC (“S,” lane 2), or SEC followed by filtration (“S + F,” lane 3). Positions of molecular weight standards (A and B) are shown on the left. The gels are representative of those obtained in each of at least three independent experiments.

