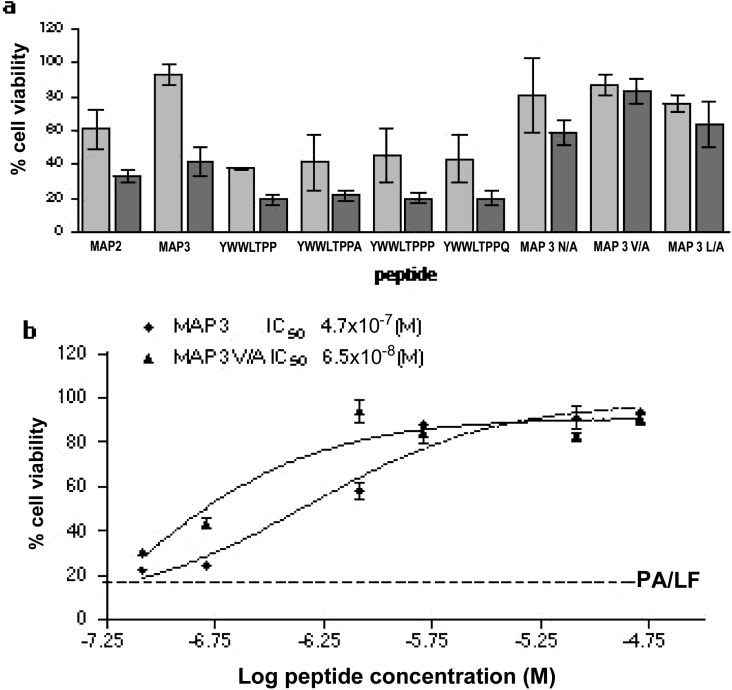
Figure 6. Inhibitory activity of lead and modified MAPs on lethal-toxin-induced cell death.
(a) J774A.1 cells were incubated with purified PA83 and LF in the presence of MAPs at concentrations of 8 μM (light grey bars) and 0.8 μM (dark grey bars). Results are means±S.D. for triplicate samples in three independent experiments. (b) Comparison of MAP3 and MAP3 V/A inhibitory activity. Assays were performed in triplicate, and IC50 values were calculated by non-linear regression analysis using GraphPad Prism 3.02 software. The broken line shows average cell viability obtained in the absence of peptides. Results are means±S.D. for at least three experiments.

