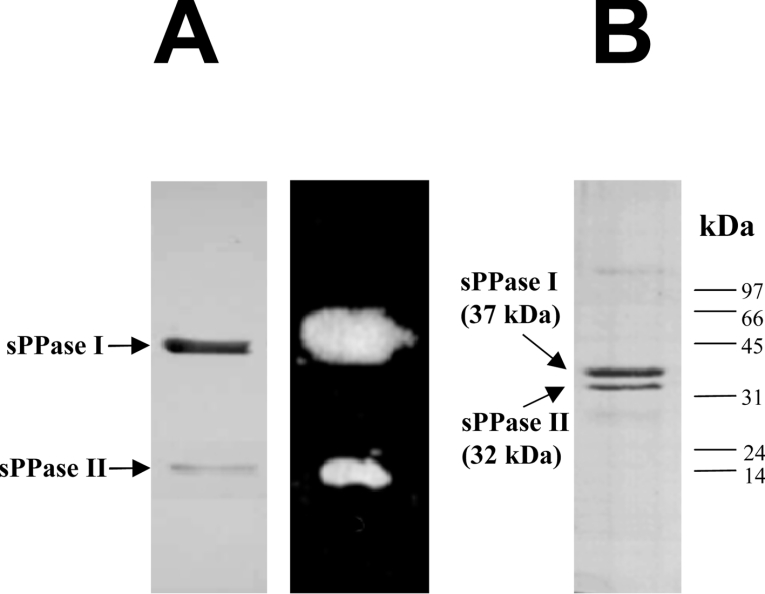
Figure 1. Native and SDS/PAGE analysis of Cr-sPPases.
(A) Non-denaturing PAGE analysis of purified Cr-sPPases (hydroxyapatite eluate) separated by a 7% polyacrylamide gel. A Coomassie-Blue-stained electrophoretogram showed two protein bands with different intensities (left-hand panel), both with sPPase activity in situ (right-hand panel): a major Cr-sPPase I and a minor Cr-sPPase II. Approx. 6 μg of protein was loaded per lane. (B) SDS/PAGE (12% gel) analysis of the same preparation. The Coomassie-Blue-stained electrophoretogram also showed two protein bands with different intensities. Apparent molecular masses of 37 and 32 kDa were estimated for the major and minor Cr-sPPases respectively. The positions and molecular masses of protein standards are indicated on the right. Approx. 5 μg of protein was loaded.

