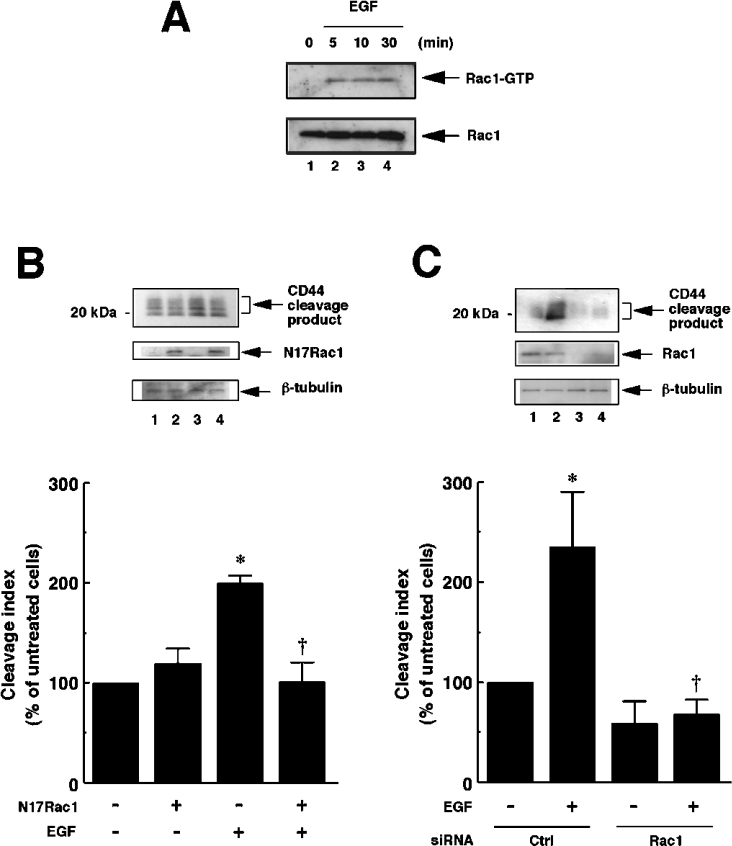
Figure 3. EGF-induced CD44 cleavage is mediated by Rac GTPase.
(A) EGF induces Rac1 activation in U251MG cells. U251MG cells were incubated with 10 ng/ml EGF for the indicated time periods. The cells were then lysed, and the extracts were incubated with glutathione–agarose-bound GST–PBD. The bound Rac1 protein (Rac1–GTP, upper panel) was detected by the pull-down assay. Lower panel, total cellular Rac1 protein. (B) Effect of dominant-negative form of Rac1 (N17Rac1) on CD44 cleavage enhanced by EGF. U251MG cells were transfected with the expression plasmid for N17Rac1 (pEF-BOS-myc-N17Rac1; lanes 2 and 4) or an empty vector (pEF-BOS; lanes 1 and 3). After incubation with (lanes 3 and 4) or without (lanes 1 and 2) 10 ng/ml EGF for 2 h, the cells were lysed and subjected to Western blot analysis using anti-CD44cyto pAb (top panel) or anti-β-tubulin mAb (bottom panel). Expression of N17Rac1 was detected by Western blotting using anti-Rac1 mAb (middle panel). The histogram shows the results of quantitative analysis of the CD44 cleavage product bands as means±S.D. for three independent experiments. (C) Effect of knockdown of endogenous Rac1 on CD44 cleavage enhanced by EGF. U251MG cells were transfected with siRNA for Rac1 (lanes 3 and 4) or control scrambled siRNA (Ctrl; lanes 1 and 2). After incubation with (lanes 2 and 4) or without (lanes 1 and 3) 10 ng/ml EGF for 2 h, the cells were lysed and subjected to Western blot analysis using anti-CD44cyto pAb (top panel) or anti-β-tubulin mAb (bottom panel). Knockdown of Rac1 was monitored by Western blotting using anti-Rac1 mAb (middle panel). The histogram shows the results of quantitative analysis of the CD44 cleavage product bands as means±S.D. for three independent experiments. *, P<0.01 compared with untreated cells; †, P<0.01 compared with EGF-treated and mock-transfected cells (ANOVA with Dunnett's post hoc test).

