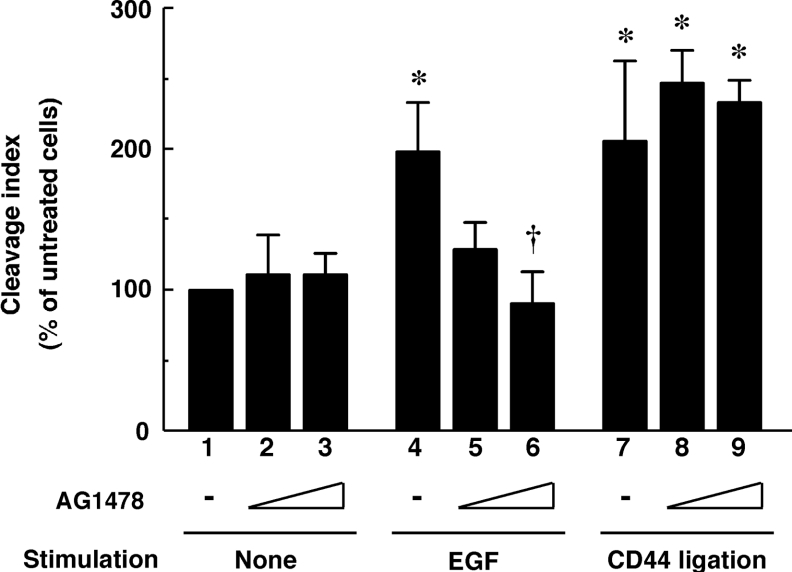
Figure 4. Difference between EGF- and CD44-induced CD44 cleavage.
U251MG cells were pre-incubated in the absence (lanes 1, 4 and 7) or presence (lanes 2, 5 and 8, 0.1 μM; lanes 3, 6 and 9, 1 μM) of AG1478 for 1 h and subsequently treated with 10 ng/ml EGF (lanes 4–6) or 1 μg/ml IM7 mAb (lanes 7–9), or left untreated (lanes 1–3) for 1 h. The cleavage index was calculated by densitometric analysis as described under the Experimental section. Results are means±S.D. for three independent experiments. *, P<0.01 compared with bar 1; †, P<0.01 compared with bar 4 (ANOVA with Dunnett's post hoc test).

