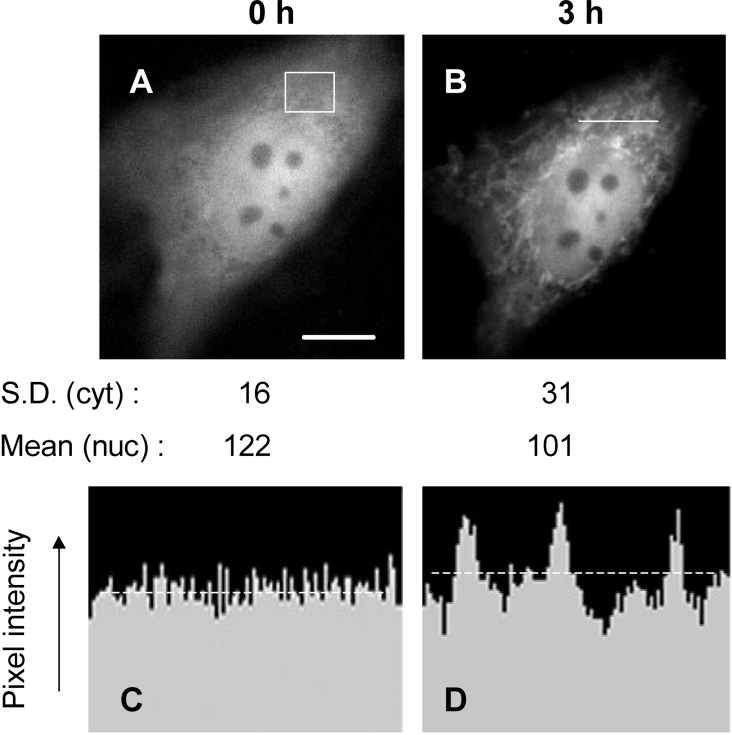
Figure 1. GFP–Bax sequestration during simulated ischaemia.
A cardiomyocyte transfected with GFP–Bax was preincubated in standard medium (the Materials and methods section) for 30 min, after which the medium was replaced with ‘ischaemic’ medium without glucose and containing cyanide. GFP–Bax was imaged immediately before the switch to ‘ischaemic’ medium (A) and 3 h after it (B). Scale bar (A), 10 μm. The standard deviations of pixel intensity values (S.D.) refer to the cytoplasmic (cyt) area boxed in (A). The mean nuclear (nuc) GFP–Bax fluorescence was obtained after defining the nuclear boundary from brightfield images. (C, D) Cross-sectional profiles of GFP–Bax fluorescence intensities before (C) and after (D) 3 h of simulated ischaemia. The position of the cross-section is given by the horizontal line in (B). The intensity profiles in (C, D) are corrected for background fluorescence and are drawn to the same scale. The broken lines indicate the mean pixel intensities.

