
Figure 4.
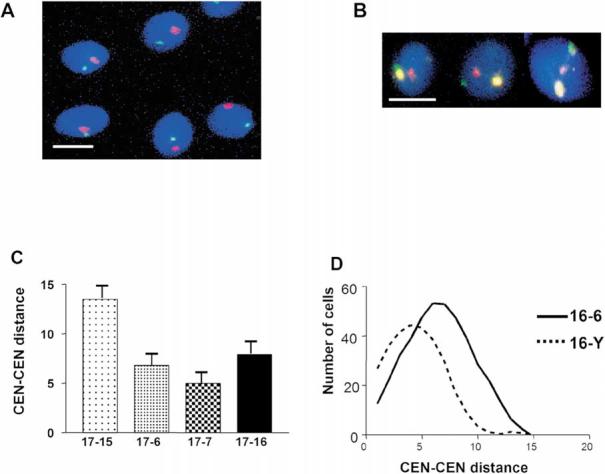
Determination of relative position of chromosomes using FISH with chromosome-specific centromere probes. Typical patterns of centromere localization by multicolor FISH which were used to measure intercentromere distances dmn, total DNA was counterstained with DAPI (blue). A. CEN16 (green), CEN18 (red). B. CEN16 (green), CEN17 (yellow) CEN X (red). Bars in A and B correspond to 5 μm. C. Chart of intercentromere distances between chromosome 17 and four selected chromosomes. Bars indicate standard errors. D. Frequency distribution plot for intercentromere distances for the chromosome pairs 16-6 and 16-Y.