
Figure 1.
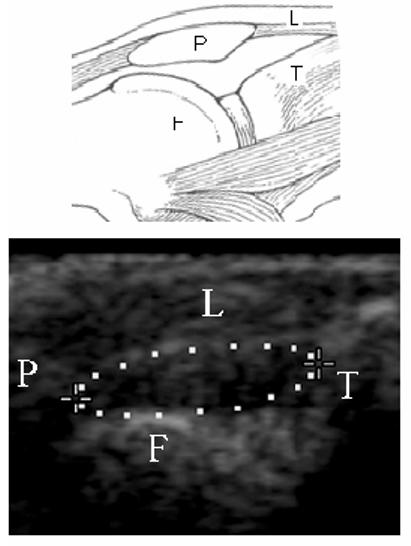
The longitudinal view of the left knee after the intraarticular injection of carrageenan. A sketch (upper part) and representative B-mode image of the knee joint. F-femur, T-tibia, P-patella, L-patellar ligament, ellipse – the measured area. In the sonogram, the knee is flexed at 90°,