
Figure 2.
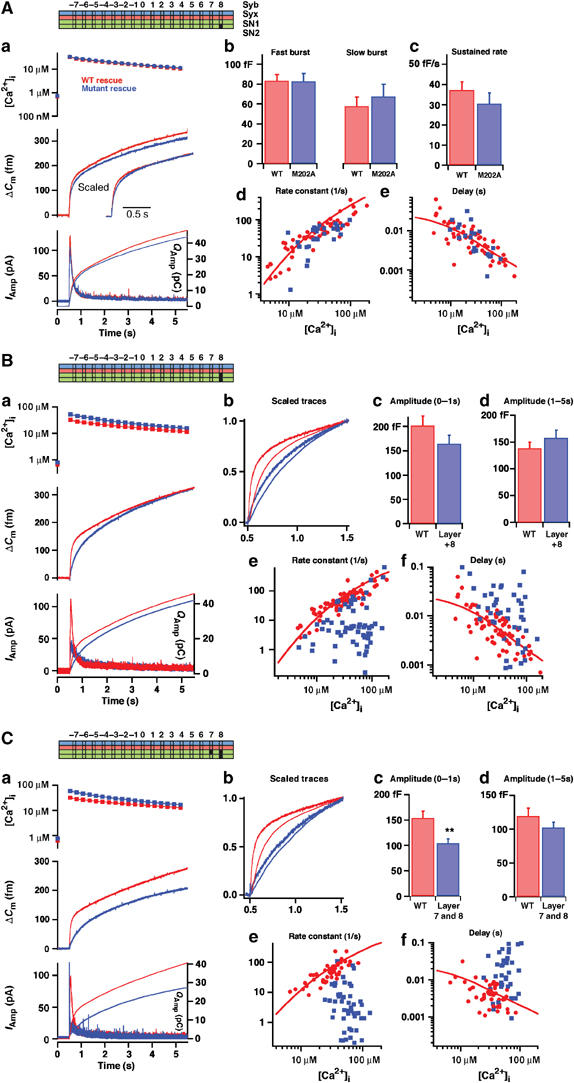
Alanine substitutions in the C-terminal end of the SNARE complex slow down the triggering phase of exocytosis. (Aa) Averaged results for SNAP-25 null cells overexpressing WT SNAP-25 (rescue, black) or SNAP-25 M202A (gray). Top panel: mean±s.e.m. [Ca2+]i before (point on left ordinate axis) and after a flash of UV light liberated calcium from the calcium cage (at 0.5 s). Middle panel: mean capacitance increase; inset: capacitance traces scaled to similar amplitude 1 s after the flash to allow comparison of the fast phase of secretion. Bottom panel: amperometric current (thick traces, left ordinate axis) and cumulative amperometric charge (thin traces, right ordinate axis). Number of cells: N=38 (WT) and N=27 (M202A). (Ab–e) Results of the kinetic analysis of individual capacitance traces (Materials and methods). (Ab) The amplitudes of the fast and slow bursts of secretion correspond to the sizes of the RRP and the SRP, respectively. (Ac) The sustained rate of secretion defines the slope of the near-linear capacitance increase following the burst phase. (Ad) Relationships between the fastest rate constant (1/time constant) resolvable in the exponential fit and the post-flash [Ca2+]i. For WT SNAP-25 rescue this is an increasing relationship. (Ae) Relationship between the secretory delay and the post-flash [Ca2+]i. For WT rescue this is a decreasing relationship. (Ad, e) Lines represent the predictions of a sequential calcium-binding site model of the fast calcium sensor for exocytosis (Voets, 2000) and describe the data in the WT situation. These data show no major change in secretion upon mutation of M202 into alanine. (B) Double mutation in layer +8 (L81A/M202A) slows down the fast phase of secretion. (Ba) Mean results; (Bb) capacitance (thick traces) and cumulative amperometric charge (thin traces) scaled to similar amplitudes at 1 s after the flash, clearly showing the slowdown induced by mutation. (Bc, d) The mean±s.e.m. capacitance increase in 0–1 s and 1–5 s after the flash is given here, because due to the slowdown caused by mutation a kinetic separation of the fast and slow bursts was not always possible. (Be, f) Result of kinetic analysis. The rate constant of the fastest resolvable phase (Be) and the delay (Bf) for WT and mutant experiments are shown. N=51 cells (L81A/M202A) and N=57 cells (WT). (C) Triple mutation in layers +7 and +8 (L78A/L81A/M202A) dramatically slows down the fast phase of secretion. For explanations of (a)–(f), see (B). With the triple mutation, the secretion within the first second of stimulation is depressed, and the secretory rates are even slower and the delays even longer than with the double mutation. N=49 cells (L78A/L81A/M202A) and N=51 cells (WT).