
Figure 1.
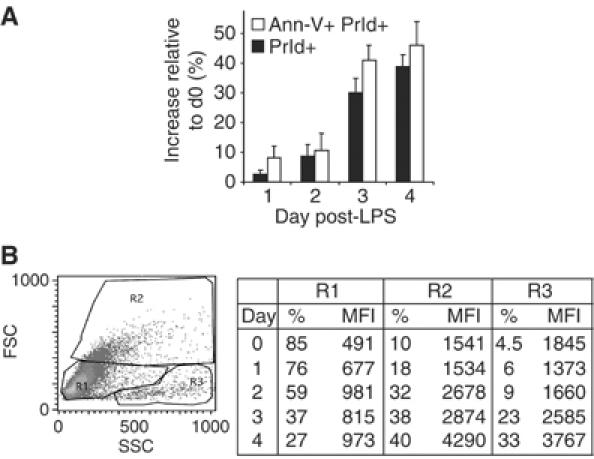
LPS-stimulated I.29μ+ cells undergo apoptosis. (A) Cell death was assessed in LPS-stimulated I.29μ+ cells by Annexin V (Ann-V) and propidium iodide (PrId) staining, and expressed as variation with respect to unstimulated cells. Mean±s.d. of three independent experiments. (B) Flow cytometry statistics of μ-chain content in LPS-stimulated I.29μ+ cells. R1, R2 and R3 were enriched in resting, activated and dead cells, respectively (van Anken et al, 2003 and our unpublished data). Mean fluorescent intensity (MFI) is indicated.