
Figure 2.
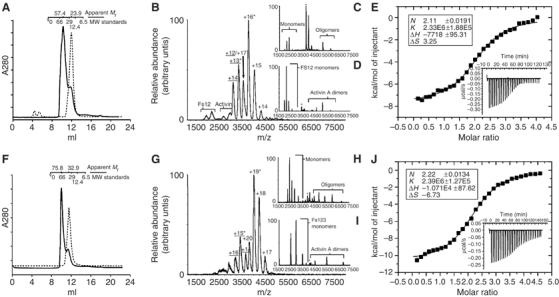
Preparation and analysis of activin–follistatin complexes. (A, F) Size exclusion chromatography of Fs12, Fs123 (dashed lines) and complexes with activin (solid lines). Elution volumes of calibration standards are illustrated above the profile along with calculated masses for the peaks. (B) Mass spectrum acquired for the activin–Fs12 complex. (C) Tandem mass spectrum for the +16 charge state of the 1:2 activin A–Fs12 complex (marked in B with an *) acquired at collision energy of 60 V. (D) Tandem mass spectrum for the +13 charge state of the 1:1 activin A–Fs12 complex (marked in B with an *) acquired at collision energy of 50 V. (G) Mass spectrum acquired for activin A–Fs123 complex. (G, H) Tandem MS acquired at collision energies of 70 V for ion species marked in (F) with asterisks, +19 and +15 charge states, respectively. (E, I) ITC data for affinity measurements for Fs12–activin (E) and Fs123–activin (I) interaction. Integrated heats and fitting to single binding site model is shown in the main figure with the raw ITC data shown in the inset of the corresponding graph. Stoichiometries, association constants and thermodynamic parameters derived from these experiments are listed in the figure.