
Figure 1.
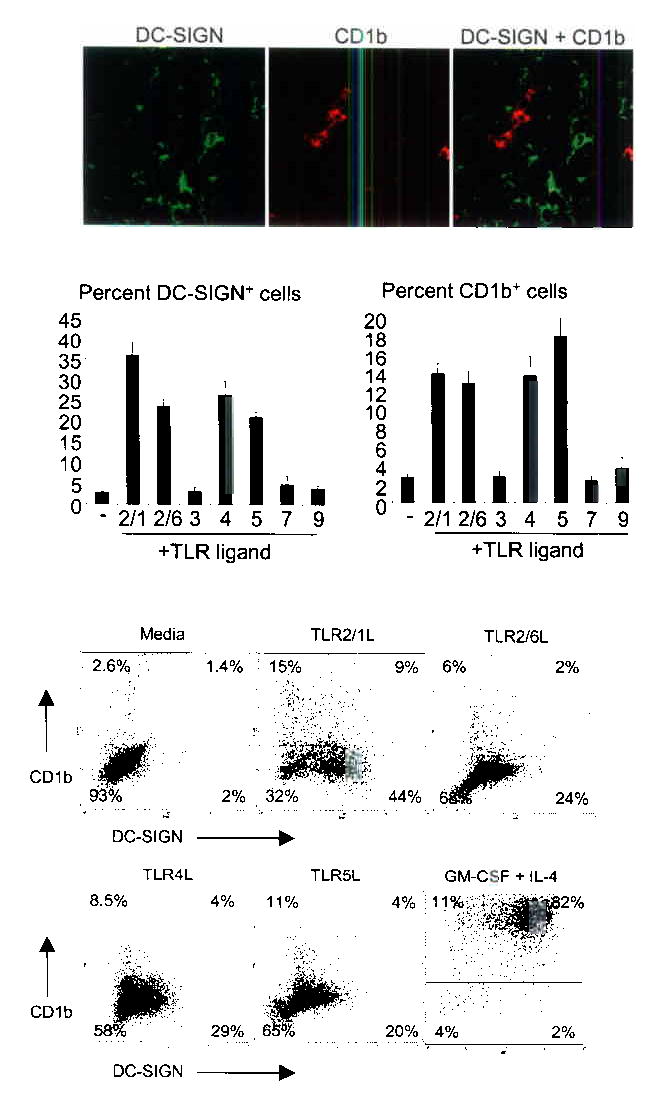
DC-SIGN and CD1b are expressed on distinct subsets of cells and are induced by TLR activation. (a) Human tonsil tissue sections were labeled with specific antibodies and visualized using confocal laser microscopy. Original magnification, 40X. (b) Human peripheral monocytes were activated with TLR ligands for 48 h and labeled with specific antibodies. Data are shown as the average ± SEM of between four and fourteen independent experiments. (c) Human peripheral monocytes were stimulated with TLR ligands for 48 h and double-labeled. Percent of cells in each quadrant are indicated. Data are representative of between three and 14 independent experiments.