
Figure 2.
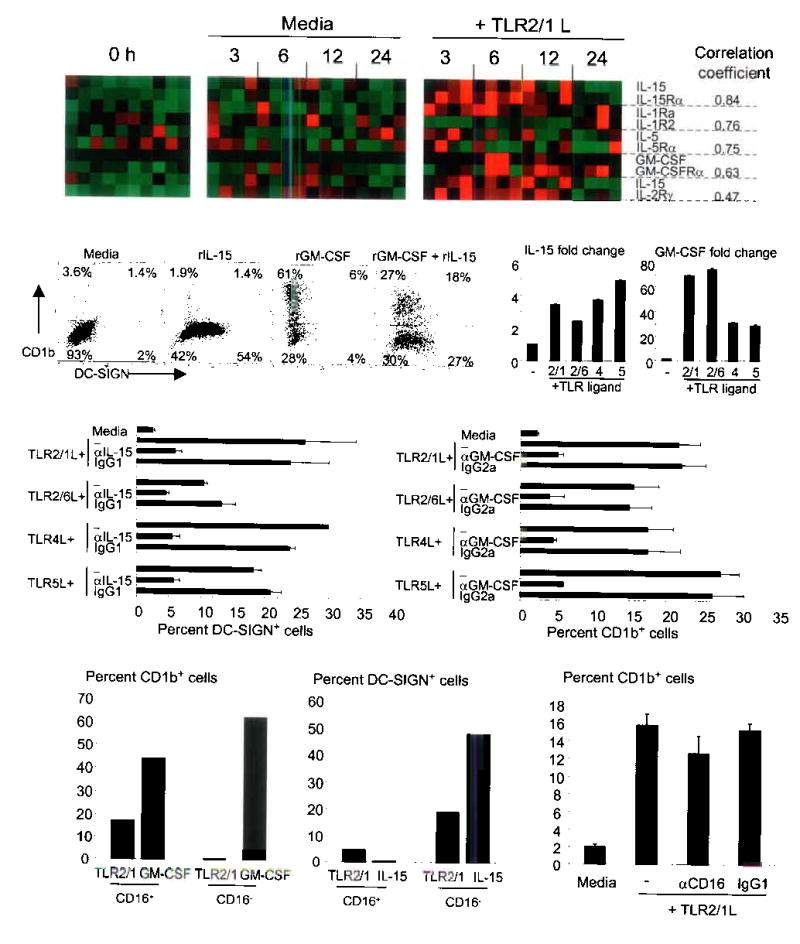
IL-15 and GM-CSF induce monocyte differentiation. (a) TLR2/1 activation triggers cytokine ligand/receptor pairs with correlated expression. Each column represents a single donor. (b) Monocytes were cultured with recombinant cytokines. Representative data shown (n=7). (c) mRNA levels of TLR-stimulated monocytes (average of duplicate wells ± SD and representative of two donors). (d) Monocytes were stimulated with TLR ligands. Data are represented as average percent positive cells ± SEM from between two and five experiments. (e) Monocyte sub-populations were activated with either the TLR2/1L or cytokines and represent data from two independent experiments. (f) Monocytes were activated with the 19 kDa TLR2/1L in various conditions. Data represent the average (n=3) ± SEM.