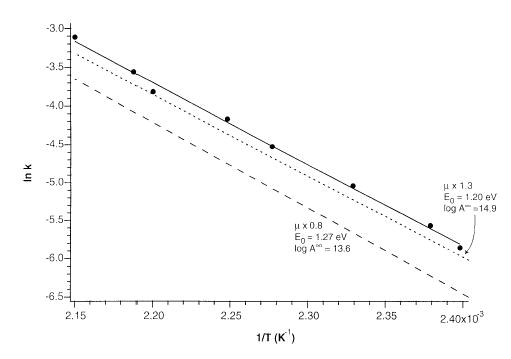
Figure 6.

Arrhenius plots for the dissociation of phosphate dimer H3PO4 · H2PO4−. The solid line is the best fit to the data (filled circle). Dotted and dashed lines represent master equation fits to the experimental data with highest and lowest E0. The transition dipole moment scaling factor used for each fit is indicated.
