
Figure 1.
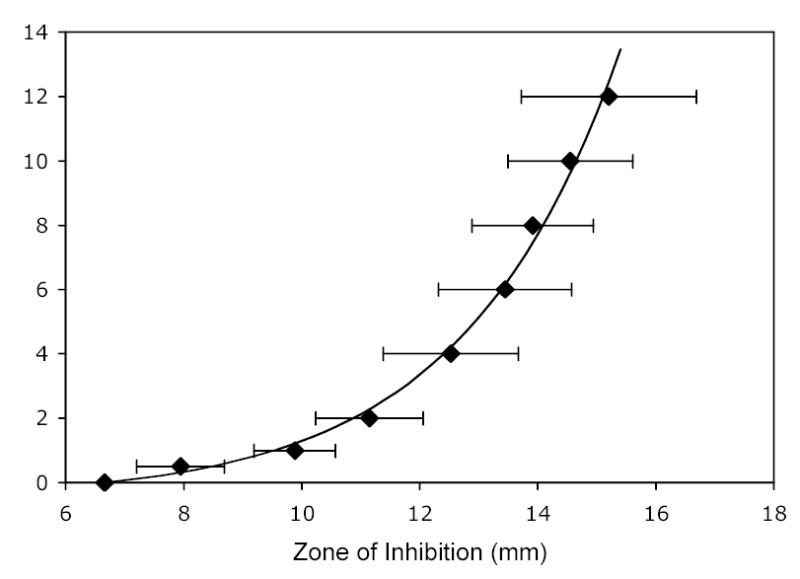
The correlation between the amount of gentamicin contained in a concentration disk and the resulting size of the zone of inhibition of E. coli. The mean and standard deviation (n=8) are represented by the diamonds and error bars; the line is the correlation given in Equation 1.