
Figure 2.
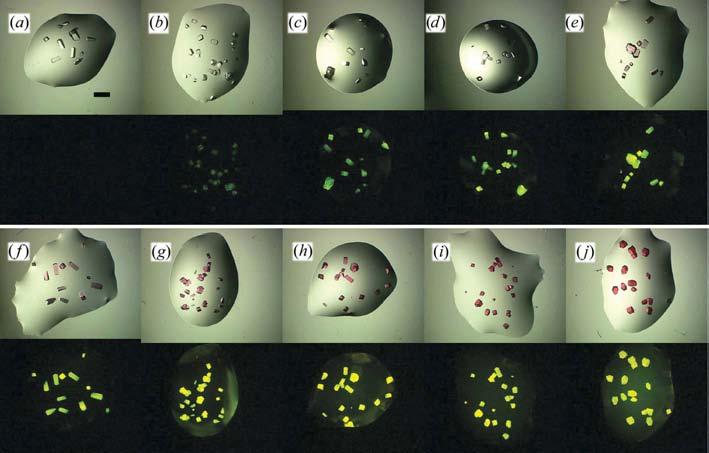
White-light (top) and fluorescent (bottom) images of RLYS crystals with varying labeling levels. (a) 0.0, (b) 0.025, (c) 0.05, (d) 0.1, (e) 0.25, (f) 0.5, (g) 1.0, (h)2.5, (i) 5.0, (j) 10.0%. The scale bar in (a) is 0.8 mm; all figures are to the same scale.