
Figure 5.
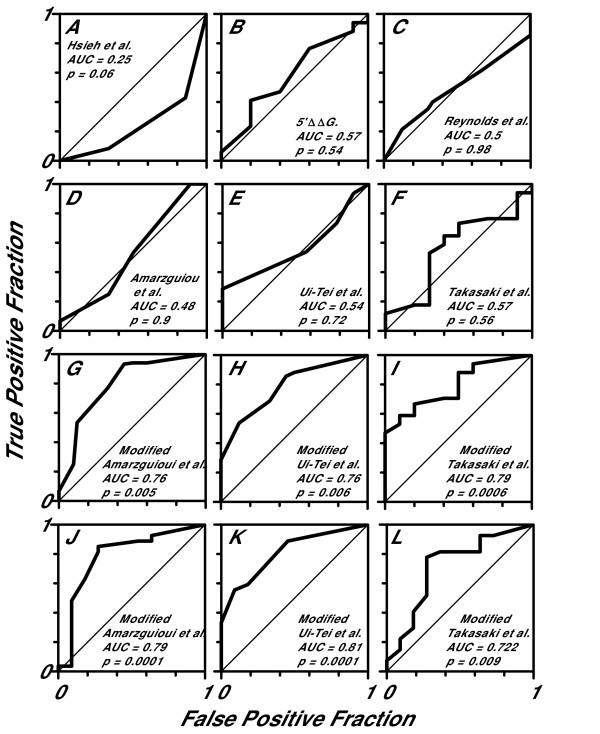
ROC curve analysis of siRNA scoring algorithms. The true positive fraction was plotted against the false positive fraction as the decision threshold varied from minimum to maximum scores (see Materials and Methods for details) for the Hsieh et al. (A), 5' ΔΔG (free energy differential) (B), Reynolds et al. (C), Amarzguioui et al. (D), Ui-Tei et al. (E) and Takasaki et al. (F) algorithms using an efficacy threshold of 50% knockdown. ROC curves for modified Amarzguioui et al. (G), Ui-Tei et al. (H) and Takasaki et al. (I) algorithms are also shown. A set of 38 published shRNAs (Table 5) was analyzed using the modified Amarzguioui et al. (J), Ui-Tei et al. (K) and Takasaki et al. (L) algorithms to confirm the utility of the modified algorithms. The area under the curve (AUC) and the probability (p) that the AUC is significantly different from 0.5, the area under diagonal, is indicated for each ROC curve.