
Figure 7.
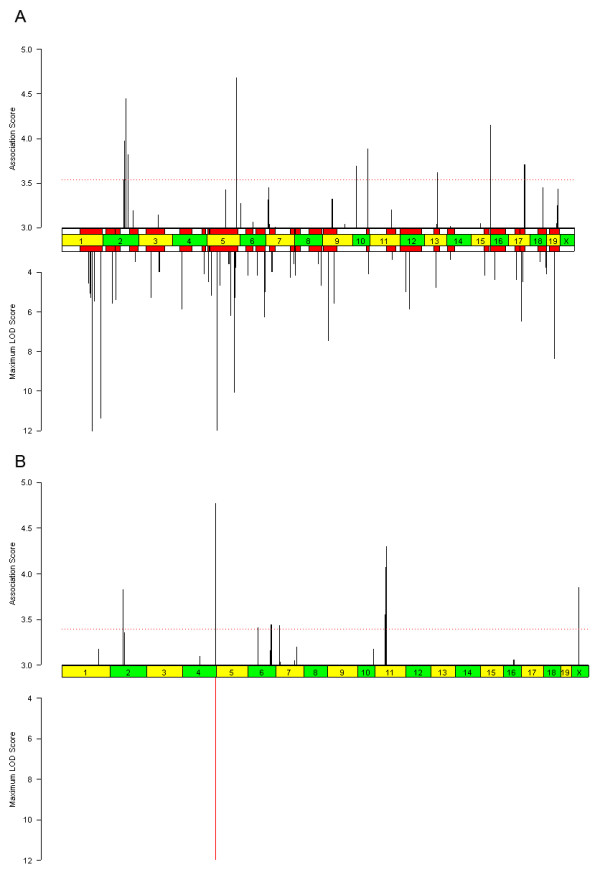
Results of inferred haplotype bootstrap (IH-B) association method for HDLC and sweet taste preference phenotypes. As in Figure 2, the top bar chart shows the association score profile, and the bottom bar chart shows the peak LOD scores and significant QTL intervals described previously for (A) HDLC and (B) sweet taste preference. In addition, the horizontal red dotted line is a gFWER threshold described in the section on "Controlling for multiple testing". Of the top twenty peaks for HDLC, fourteen intersect a previously known QTL interval and six do not.