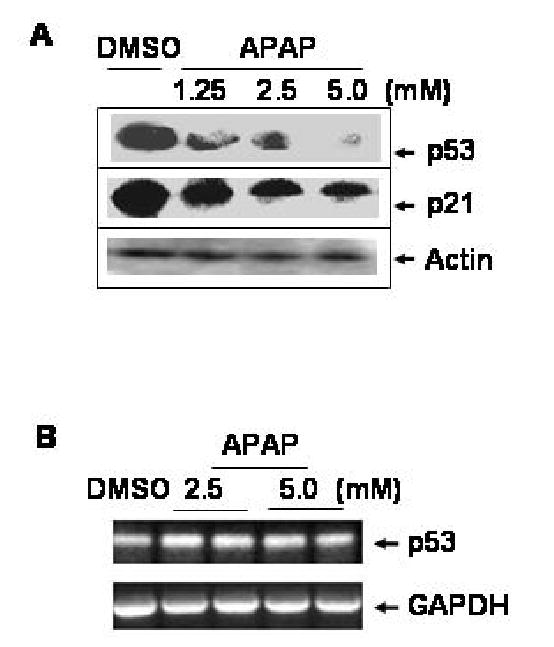
Fig. 1.

APAP concentration-dependent reduction in p53 and p21 proteins. (A) Whole cell lysates were prepared after C6 cells treated with DMSO alone or varying concentrations of APAP for 24 h as indicated. Equal amounts of the soluble extracts from different treatments (100 μg protein/well) were separated on SDS-PAGE followed by immunoblot analysis using the specific antibody, as indicated: p53, p21, and actin. Each lane represents the mixture of two different samples from the same treatment. This Figure represents a typical result from three independent experiments. (B) RT-PCR analyses for p53 and GAPDH mRNA transcripts were performed as described (Soh et al., 1996) using total cellular RNA (400 ng/assay) prepared from C6 cells treated with DMSO, 2.5, or 5.0 mM APAP for 24 h. The respective primers were the same as described for p53 (Soussi et al., 1988) or GAPDH transcript (Soh et al., 1996). Each amplified DNA band represents a mixture of three samples.
